Flavobacterium oreochromisis a major bacterial pathogen that causes columnaris disease in tilapia (Oreochromis spp.) and other freshwater fish species. A research team with members from Faculty of Fisheries and Faculty of Veterinary Medicine, Vietnam National Universtiy of Agriculture carried out a study to assess the antibiotic resistance profiles and minimum inhibitory concentrations (MICs) of F. oreochromisisolates obtained from infected tilapia cultured in Northern Vietnam.
A total of 51 isolates retrieved from diseased fish collected in Hai Duong (n = 23), Bac Ninh (n = 16), and Hoa Binh (12 isolates) were used in the study. The bacteria were cultured on TYES agar, identified through morphological and biochemical analyses, and confirmed by PCR. Antimicrobial susceptibility testing employed the disk diffusion method against 15 antibiotics, while the MICs of six frequently used antibiotics were determined via the broth microdilution method. The antimicrobial susceptibility test revealed that the isolates exhibited high resistance to oxacillin (100%) and neomycin (76.5%), and moderate resistance to sulfamethoxazole-trimethoprim (37.3%), doxycycline (35.3%), and oxytetracycline (41.2%). Resistance values to the remaining antibiotics were below 12%. Notably, all the isolates were multidrug-resistant (MDR), exhibiting resistance to 2-10 antibiotics, and 14 distinct resistance phenotypes were identified. The MIC values ranged from 0.063-1 μg mL-1 for amoxicillin, 0.125-8 μg mL-1for erythromycin, and 0.25-8 μg mL-1 for florfenicol. For oxytetracycline, doxycycline, and sulfamethoxazole-trimethoprim, the MICs ranged from 0.016-1 μg mL-1, 0.125-2 μg mL-1, and 0.5-16 μg mL-1, respectively.
    |
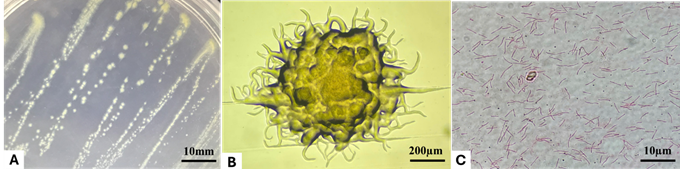 |
| Figure 1. Colony morphology on TYES agar (A, B) and cell morphology (C) of a Flavobacterium oreochromis isolate used in this study |
Table 1. Morphological and biochemical characteristics of the Flavobacterium oreochromis isolates in this study
|
Characteristics
|
Isolates from this study
(n = 51)
|
F. columnare
ATCC 23463
|
|
Gram staining
|
-
|
-
|
|
Bacterial morphology
|
long, slender rod
|
long, slender rod
|
|
Colony morphology
|
rhizoid
|
rhizoid
|
|
Gliding motility
|
+
|
+
|
|
Growth on TSA
|
-
|
-
|
|
Flexirubin pigments
|
+
|
+
|
|
Congo red
|
+
|
+
|
|
Cytochrome Oxidase
|
+
|
+
|
|
Gram staining
|
-
|
-
|
Table 2. Distribution of the MIC values of the F. oreochromis isolates for six antimicrobial agents
|
Antimicrobials
|
Number of isolates with MIC (µg mL-1)
|
MIC50
|
MIC90
|
|
0.008
|
0.016
|
0.032
|
0.063
|
0.125
|
0.25
|
0.5
|
1
|
2
|
4
|
8
|
16
|
|
Amoxicillin
|
|
|
|
5
|
16
|
21
|
6
|
3
|
|
|
|
|
0.25
|
0.5
|
|
Erythromycin
|
|
|
|
|
7
|
13
|
12
|
9
|
5
|
3
|
2
|
|
0.5
|
2
|
|
Florfenicol
|
|
|
|
|
|
4
|
8
|
17
|
9
|
11
|
2
|
|
1
|
4
|
|
Oxytetracycline
|
|
6
|
9
|
7
|
11
|
13
|
3
|
2
|
|
|
|
|
0.125
|
0.25
|
|
Doxycycline
|
|
|
|
|
18
|
21
|
9
|
3
|
|
|
|
|
0.25
|
0.5
|
|
Sul/Trim
|
|
|
|
|
|
11
|
7
|
7
|
9
|
12
|
5
|
|
2
|
4
|
Note: M: molecular marker; lanes 1-6: six representative isolates of F. oreochromis retrieved from tilapia in this study; N, P: negative and positive controls.
Figure 2. Representative gel electrophoresis of PCR products of species-specific primers for F. oreochromis identification
|
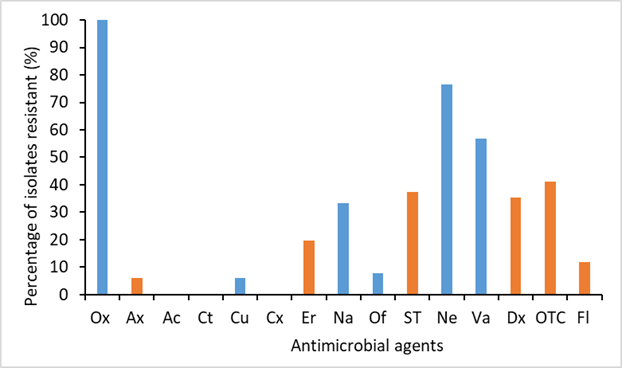 |
| Figure 3. Antibiotic resistance frequencies of the F. oreochromis isolates obtained from diseased tilapia. The orange columns indicate antibiotics approved for use in aquaculture in Vietnam. |
Table 3. Multidrug resistance phenotypes of the F. oreochromis isolates in infected tilapia observed in this study
|
No. of resistant antibiotics
|
Resistance phenotypes
|
No. of resistant isolates
|
Percentage of isolates resistant (%)
|
|
2
|
Ox + OTC
|
5
|
9.8
|
|
Ox+Ne
|
7
|
13.7
|
|
Ox+Na
|
3
|
5.9
|
|
3
|
Ox + Ne + Va
|
11
|
21.6
|
|
Ox+Ax+Ne
|
3
|
5.9
|
|
4
|
Ox+ST+Ne+Va
|
4
|
7.8
|
|
Ox+ST+Dx+OTC
|
4
|
7.8
|
|
7
|
Ox+Na+Of+ST+Ne+Va+Dx
|
2
|
3.9
|
|
8
|
Ox+Na+Of+ST+Ne+Va+Dx+OTC
|
2
|
3.9
|
|
Ox+Er+Na+ST+Ne+Va+Dx+OTC
|
4
|
7.8
|
|
Ox+Er+Na+Ne+Va+Dx+OTC+Fl
|
3
|
5.9
|
|
10
|
Ox+Cu+Er+Na+ST+Ne+Va+Dx+OTC+FL
|
3
|
5.9
|
|
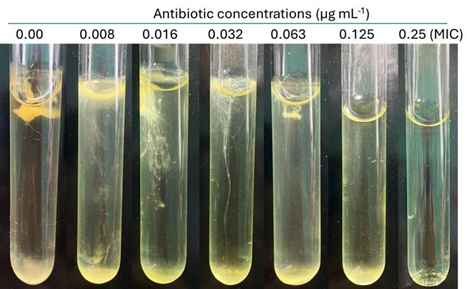 |
| Figure 4. Visualization of the growth inhibition of F. oreochromis at different concentrations of amoxicillin. Bacterial growth decreased progressively with increasing antibiotic concentrations (0-0.125 µg mL-1), and no visible growth was observed at concentrations ≥0.25 µg mL-1, indicating the MIC at this level. |
Flavobacterium oreochromis isolated from diseased tilapia exhibited considerable variability in susceptibility and resistance across different antibiotics. The relatively high resistance rates to several commonly used antimicrobial agents in aquaculture highlight the potential decline in treatment efficacy and a narrowing of antibiotic options for managing infections. MIC values vary among bacterial isolates, species, and host fish species, indicating that using a uniform antibiotic dosage across different bacterial infections may compromise treatment outcomes and increase the risk of antimicrobial resistance.
These findings highlight a decline in the efficacy of commonly used antibiotics against F. oreochromis, underscoring the necessity for routine antimicrobial susceptibility testing to promote rational antibiotic use in aquaculture.
For the full paper, please visit https://doi.org/10.31817/vjas.2025.8.4.03.
Vietnam Journal of Agricultural Sciences